


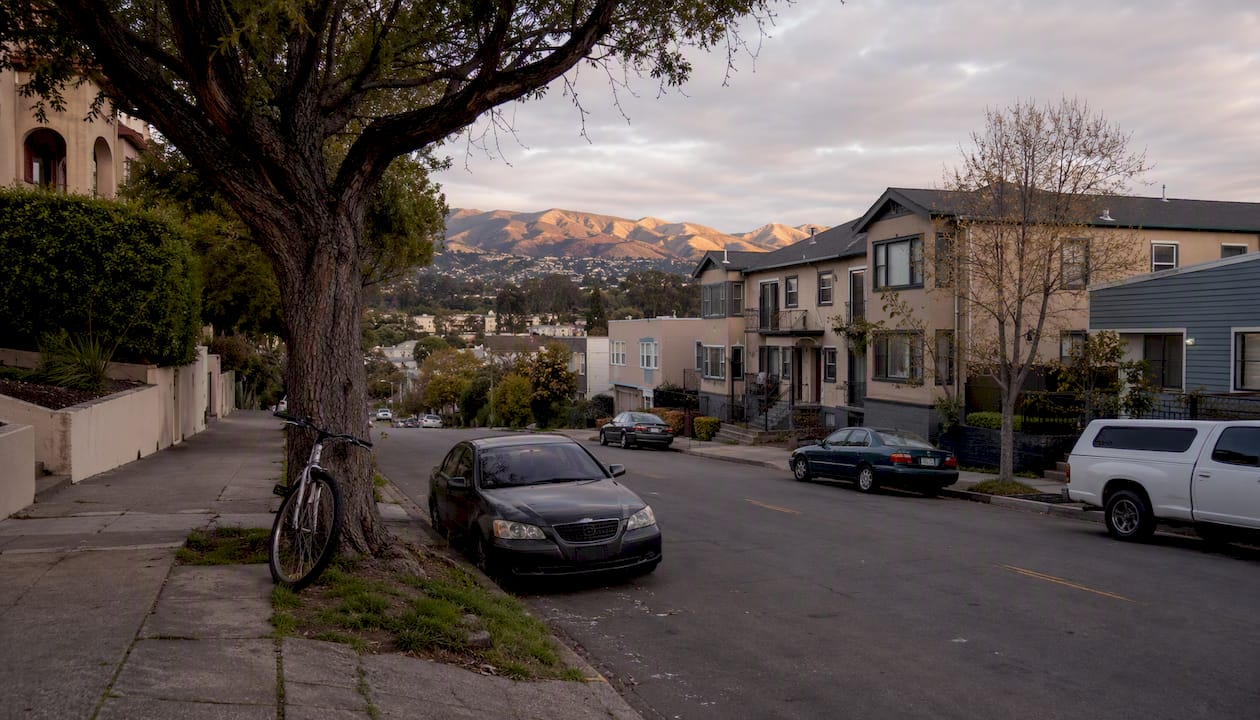
The East Bay housing market in 2026 remains a low-inventory, price-resilient seller’s market, though neighborhood-level variation is significant enough to change your strategy entirely depending on where you focus. Bay East’s monthly market statistics show median sale prices holding firm or edging upward year-over-year across most Alameda County cities, while months of supply stays compressed well below the six-month threshold that signals a balanced market. Sales velocity is brisk in the most sought-after submarkets, with median days on market in the low double digits in cities like Berkeley and Fremont. If you are a seller, now is still a strong window to list. If you are a buyer, preparation and speed matter more than patience.
- Median sale prices: trending up year-over-year in most East Bay cities, with Alameda County outpacing Contra Costa in price appreciation
- Inventory: persistently low, keeping months of supply below equilibrium in the majority of communities
- Days on market: short in core cities, longer in higher-priced or condo-heavy submarkets
- Immediate recommendation: Sellers should list before fall inventory typically rises; buyers should get pre-approved and define their target neighborhoods before touring
Key Takeaways
The East Bay housing market in 2026 is a low-inventory seller’s market where preparation and neighborhood-level strategy determine outcomes for buyers, sellers, and investors alike.
| Point | Details |
|---|---|
| Market verdict | Low inventory and firm prices define a seller’s market across most East Bay cities in 2026. |
| Buyer priority | Pre-approval and neighborhood focus matter more than waiting for a price correction the supply data does not support. |
| Seller timing | Listing before the fall inventory uptick gives sellers a competitive window with less competition. |
| Investor focus | Multi-unit properties in Oakland and Berkeley offer rental income potential; underwrite carefully for rent control and local costs. |
| Data cadence | Bay East publishes monthly one-page statistics and video Weather Reports; the archive goes back to 2003 for historical context. |
| Kenneth Hogan | Over 20 years of local expertise in Berkeley and the Greater Bay Area, with neighborhood-specific strategies for buyers, sellers, and investors. |
Table of Contents
- The East Bay real estate market by the numbers
- Which East Bay submarkets are hottest right now
- What is driving the East Bay market in 2026
- Tactical next steps for buyers, sellers, and investors
- Where these numbers come from
- Kenneth’s 6–12 month forecast: three scenarios
- Rent vs. buy in the East Bay: what the numbers actually say
- Demographic shifts shaping East Bay demand
- The East Bay market in historical context
- A local agent’s read on the market
- How Kenneth Hogan can help you move with confidence
- Sources
The East Bay real estate market by the numbers
The table below draws from Bay East’s June 2026 market statistics and C.A.R. market update charts, which together provide the most current and comprehensive picture of East Bay residential activity.
| Metric | Current Level | YoY Direction | QoQ Direction |
|---|---|---|---|
| Median sale price (single-family) | Above $1M in Alameda County core | Up | Flat to slightly up |
| Months of supply | Below 2.0 in most cities | Down | Flat |
| Units sold (monthly) | Moderate, below 2021–2022 peaks | Down slightly | Flat |
| Median days on market | Low teens in core cities | Down | Down |
| Median price per sq ft | Elevated, reflecting land scarcity | Up | Flat to up |
Sources: Bay East monthly one-page reports; C.A.R. market update graphics. Bay East publishes updated figures monthly; the archive extends back to 2003.
A few trends stand out when you look across these metrics together:
- Price per square foot is rising faster than unit volume, which tells you demand is concentrated rather than broad-based.
- Months of supply below 2.0 in the tightest submarkets means buyers are competing for a very thin pool of active listings.
- Days on market dropping quarter-over-quarter in core cities suggests the spring 2026 selling season accelerated faster than the prior year.
- Sales volume remains below the pandemic-era peaks, reflecting affordability constraints rather than weak demand. Buyers want to buy; many simply cannot qualify at current prices and rates.
- The Bay East Real Estate Weather Reports compare each month’s activity directly to the same month a year earlier using Bay East MLS data, making them the clearest tool for reading short-term momentum.
Which East Bay submarkets are hottest right now
Geographic variation in the East Bay is wide enough that “the market” can mean very different things depending on the city. Here is how the major submarkets break down.
Oakland and Berkeley (Alameda County core)
- Berkeley continues to see fast absorption in single-family homes, with well-priced listings in neighborhoods like Elmwood and Claremont receiving multiple offers within the first week.
- Oakland’s market is more segmented: the hills and Rockridge remain competitive, while flatlands neighborhoods and the condo market show longer days on market and occasional price reductions.
- Berkeley’s Southwest Berkeley corridor has attracted buyer interest from buyers priced out of North Berkeley, compressing days on market in that submarket.
The Oakland condo market is worth watching separately. Inventory in attached units has risen relative to single-family supply, and some sellers are accepting offers below list price, a pattern not common in the detached segment.
Fremont and the South Bay–adjacent corridor
- Fremont consistently ranks among the fastest-moving markets in the East Bay, driven by proximity to Silicon Valley employers and BART access.
- Median prices in Fremont have held above regional averages, and inspection contingency waivers remain common in competitive offer situations.
- Newark and Union City, adjacent to Fremont, offer relative value and are attracting buyers who have been outbid in Fremont multiple times.
Contra Costa County cities (Walnut Creek, Concord, Pleasant Hill)
- Contra Costa cities offer more inventory relative to Alameda County, giving buyers slightly more negotiating room.
- Walnut Creek’s single-family market remains steady, though price growth has moderated compared to 2022–2023 peaks.
- Concord and Antioch represent the most affordable entry points in the broader East Bay, attracting first-time buyers and investors seeking cash-flow-positive rental properties.
Pro Tip: City-level community pages on BayEast.org let you pull inventory counts, units sold, and median prices for individual municipalities. Comparing two adjacent cities side by side often reveals a price gap that creates a real opportunity for buyers willing to shift their search by a few miles.
What is driving the East Bay market in 2026
Several forces are working simultaneously, and understanding which ones are structural versus cyclical helps you judge whether current conditions will persist.
Mortgage rates and affordability
Rates remain elevated relative to the 2020–2021 lows, and that has a direct effect on purchasing power. The C.A.R. Housing Affordability Index methodology shows how even a half-point rate move shifts the share of households that can qualify for a median-priced home. In the East Bay, where median prices exceed $1 million in many cities, affordability is the binding constraint for a large share of potential buyers. That is one reason sales volume is below prior peaks even as prices hold firm: the buyers who can qualify are competing hard for a limited pool of homes, while a larger group of would-be buyers remains sidelined.
Low listings and constrained supply
New listing volume has not recovered to pre-pandemic norms. Homeowners who locked in 3% mortgages between 2020 and 2022 have little financial incentive to sell and take on a new loan at current rates, a dynamic the industry calls the “lock-in effect.” This keeps resale inventory thin and sustains upward price pressure even when demand is not at peak levels.
Local employment: tech, education, and healthcare
The East Bay’s employment base is more diversified than San Francisco’s, anchored by UC Berkeley, major healthcare systems, and a mix of tech employers in Oakland and the I-880 corridor. That diversification has cushioned the market from the sharper corrections seen in some San Francisco neighborhoods following tech-sector layoffs. Job stability in education and healthcare supports consistent demand from buyers who are not dependent on stock-option windfalls.
Rental market dynamics
Rising rents across the East Bay have kept the rent-vs.-buy calculation in flux, pushing some renters toward ownership even at high prices. For investors, the rental income potential on multi-unit properties in Oakland and Berkeley remains a draw, though local rent control ordinances affect net returns on some property types. We cover the rent-vs.-buy comparison in more detail in a later section.
New development and zoning changes
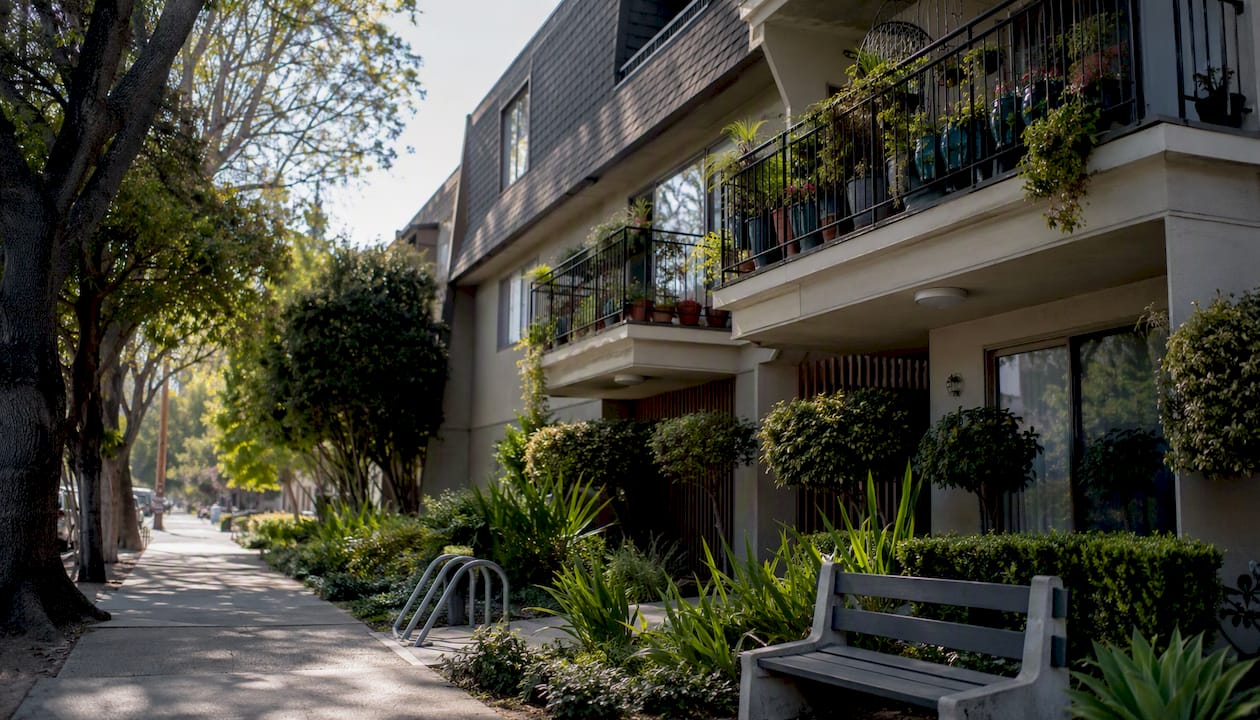
California’s housing laws, including ADU-friendly legislation and recent upzoning near transit corridors, are slowly adding supply in some East Bay cities. However, new construction timelines are long, and the near-term impact on inventory is limited. Alameda County’s city planning pages are the practical starting point for checking what is approved or under review in a specific municipality.
Pro Tip: Sellers who list in late summer, before the typical September inventory uptick, often face less competition from other listings. If your home is ready, pricing it in August rather than waiting for the fall can meaningfully reduce days on market.
Tactical next steps for buyers, sellers, and investors
For buyers
- Get fully pre-approved, not just pre-qualified. In a market where offers are reviewed quickly, a conditional pre-qualification letter is not enough.
- Define your must-have list by neighborhood, not just by city. Oakland hills and Oakland flatlands are effectively different markets.
- Review Bay East’s city-level statistics for your target area before making an offer. Knowing the median days on market and sale-to-list ratio tells you how aggressively to price your offer.
- Work with an agent who tracks active listings daily. In submarkets where homes sell in under two weeks, a 48-hour delay in seeing a new listing can cost you the opportunity.
- Read our guide on navigating fluctuating interest rates before locking your rate.
First-time buyers should also review our first-time homebuyer tips before starting their search.
For sellers
- Price at or just below the comparable sales range to generate multiple offers rather than pricing high and sitting.
- Prepare the home before listing: fresh paint, decluttered spaces, and professional photography are the three highest-return preparation steps.
- Expect a short window from list to accepted offer in most core East Bay markets under current conditions.
- If days on market exceed 21 without an accepted offer, a price review is warranted. Buyers notice stale listings quickly.
- Our home staging guide covers preparation tactics that consistently reduce time on market.
For investors
- Multi-unit properties in Oakland and Berkeley offer rental income potential, but factor in local rent control rules before underwriting returns.
- Contra Costa cities like Concord offer lower entry prices and fewer rent control restrictions, which can improve cash flow on smaller portfolios.
- Watch the condo submarket in Oakland for potential value opportunities as inventory in attached units rises relative to demand.
- Review our multi-unit and duplex services page for guidance specific to investment property transactions.
Where these numbers come from
Transparency about data sources matters, especially when market conditions shift month to month. Here is what we use and how often it updates.
- Bay East monthly market statistics: One-page reports covering supply, sales prices, and sales activity for East Bay communities. Published monthly; the archive extends back to 2003, making it the most comprehensive longitudinal source for local MLS data.
- Bay East Real Estate Weather Reports: Monthly video briefings that compare the current month’s activity with the same month a year earlier, using Bay East MLS-supplied data. The August 2026 edition is the most current available.
- C.A.R. market update charts: Statewide and regional charts that provide California context for East Bay trends. Useful for comparing East Bay affordability against state benchmarks.
- C.A.R. Housing Affordability Index: Calculated using a standardized methodology explained in the HAI documentation. The index measures the share of households that can afford the median-priced home at prevailing rates.
- Local MLS feeds: Bay East MLS is the primary data feed for East Bay transactions. City-level community pages on BayEast.org let you drill into individual municipalities.
A few methodology notes worth keeping in mind: YoY comparisons smooth out seasonal noise better than month-over-month figures, but they can lag turning points by several months. Single-family detached and attached (condo/townhome) data are reported separately by Bay East, and mixing them can distort median price readings. When comparing submarkets, confirm you are looking at the same property type across both.
Kenneth’s 6–12 month forecast: three scenarios
No forecast is certain, but scenario planning gives buyers, sellers, and investors a framework for decision-making rather than waiting for perfect clarity that never arrives.
Base scenario (most likely)
Sales volume stays moderate. Sellers retain pricing power in well-prepared, well-located homes. Buyers face continued competition in core markets but find more room to negotiate in the condo segment and in Contra Costa’s outer cities.
- Recommendation: Sellers should list now or in early fall. Buyers should act on well-priced homes rather than waiting for a price correction that the supply picture does not support.
Best scenario
Multiple-offer situations become more common across a wider range of price points.
- Recommendation: Buyers who are close to qualifying should move now before a rate drop triggers a demand surge. Sellers benefit from waiting for this scenario to materialize before listing, if their timeline allows.
Downside scenario
Rates rise above 7.5% or a significant local employer contraction reduces demand. Days on market lengthen, price reductions become more common, and months of supply approaches or exceeds 3.0 in some cities. The condo market softens further.
- Recommendation: Sellers should price conservatively and invest in preparation to stand out. Investors should stress-test underwriting at higher vacancy rates and lower rent growth assumptions.
Pro Tip: Monitor the Bay East Real Estate Weather Reports monthly. When the YoY comparison shifts from “prices up, days on market down” to “prices flat, days on market up” for two consecutive months, that is an early signal the market is transitioning. You do not need to wait for a headline to tell you.
For a deeper read on where rates may move, see our analysis of interest rate trends.
Rent vs. buy in the East Bay: what the numbers actually say
The rent-vs.-buy decision in the East Bay is genuinely close for many households, and the answer depends heavily on how long you plan to stay. At current price levels and mortgage rates, monthly ownership costs on a median-priced East Bay single-family home typically exceed comparable rents by a meaningful margin when you factor in principal, interest, taxes, and insurance. That gap has narrowed somewhat as rents have risen, but it has not closed.
For buyers with a 5-plus-year horizon, the equity accumulation and price appreciation history of the East Bay tend to favor buying despite the higher monthly cost. For households with a shorter horizon or uncertain job situations, renting preserves flexibility without the transaction costs of a purchase and resale.
The rental market itself is active. Oakland and Berkeley have seen rent growth moderate from the sharp increases of 2021–2022, but vacancy rates remain low enough to sustain landlord pricing power in most neighborhoods. For investors, gross rental yields on multi-unit properties in Oakland can be attractive on paper, but net yields after local taxes, maintenance, and rent control compliance costs require careful underwriting. Our multi-unit services page outlines what to evaluate before purchasing an investment property in a rent-controlled jurisdiction.
Demographic shifts shaping East Bay demand
The East Bay’s buyer pool has shifted in ways that are not always visible in the headline price data. Remote and hybrid work arrangements have extended the geographic range of buyers who previously needed to live within a short commute of San Francisco or Silicon Valley. That shift has brought buyers into East Bay cities who would not have considered them five years ago, adding a layer of demand that is not purely local.
At the same time, the East Bay has a large and growing millennial cohort moving into peak home-buying years. Many of these buyers are dual-income households with strong earnings but limited down payment savings, given the region’s high cost of living. That profile drives demand for condos and smaller single-family homes in the $700,000–$1.1 million range, which is one reason that segment has remained competitive even as the broader market has cooled from its 2022 peak.
Retirees and long-time homeowners are also a meaningful segment. Many hold substantial equity in homes they purchased decades ago and are weighing whether to downsize, sell outright, or convert to a rental. The decision is often as much about lifestyle and tax planning as it is about the market, and it benefits from a conversation with an agent who understands both the financial and emotional dimensions of that transition.
The East Bay market in historical context
The Bay East Market Statistics Archive covers monthly data back to 2003, which puts current conditions in a useful long-term frame. The East Bay has experienced three distinct cycles in that period: the pre-2008 run-up and subsequent correction, the long recovery from 2012 through 2019, and the pandemic-era surge followed by the 2022–2023 rate-driven slowdown.
What stands out across all three cycles is that the East Bay’s price floor has consistently held above the prior cycle’s peak within a few years of each correction. The structural supply constraint, driven by geography, zoning, and the political difficulty of approving new housing at scale, has been a persistent floor under prices. That does not mean prices cannot fall in a downside scenario, but it does mean the East Bay has historically recovered faster than many comparable metros.
The 2022–2023 period is instructive. But by mid-2023, prices in core cities had stabilized, and by 2024 they were recovering. That pattern is consistent with the structural supply argument: demand compressed, but supply did not flood the market, so the correction was shallower and shorter than many predicted.
A local agent’s read on the market
The data tells one story. The experience of writing offers, sitting across from listing agents, and watching how buyers respond to specific homes tells another. What we see in 2026 is a market that rewards preparation more than timing. Buyers who arrive with financing locked, a clear neighborhood focus, and realistic expectations about competition consistently outperform those who are still “exploring.” Sellers who invest in presentation and price with discipline, rather than testing the market with an aspirational number, are closing faster and with fewer concessions.
Neighborhood-level strategy is not optional in the East Bay. A pricing approach that works in Fremont may leave money on the table in Berkeley, and vice versa. The submarket data in Bay East’s community pages is the starting point, but interpreting what it means for your specific property requires someone who has been inside comparable homes and knows how buyers in that neighborhood behave.
If you would like a personalized market snapshot for your neighborhood or a seller pricing call, we are glad to walk through the current comps with you directly.
How Kenneth Hogan can help you move with confidence

Kenneth Hogan brings over 20 years of Berkeley and Greater Bay Area experience to every transaction, with a focus on the neighborhood-level detail that generic market reports cannot provide. Whether you are buying your first home, listing a property you have owned for decades, or evaluating a multi-unit investment, the approach is the same: clear data, honest pricing guidance, and a strategy built around your specific situation.
Core services include buyer representation, listing and seller services, condo and attached-unit expertise, multi-unit investment guidance, staging and preparation advice, and interest-rate navigation support. For sellers, that means a pricing strategy grounded in current MLS data and a marketing approach designed to attract both local and regional buyers. For buyers, it means knowing which neighborhoods match your goals and how to compete effectively without overpaying.
Ready to take the next step? Connect with Kenneth Hogan for a no-pressure consultation and a current market snapshot for your target neighborhood.
Sources
This article provides general market information and is not a substitute for professional real estate, financial, or legal advice. Confirm current market conditions and applicable rules with a licensed professional or the primary sources listed above.